Three novel naphthalene-based azo dyes incorporating boronic acid functional groups were synthesized. Their sugar-sensing behavior toward glucose and fructose was systematically investigated using UV-visible, fluorescence, time-resolved fluorescence, pH titration, and cyclic voltammetry techniques. Upon increasing the concentration of the sugars, both the absorbance and fluorescence intensities of the dyes decreased, indicating effective interaction. In the excited state, the dyes exhibited stronger sensing responses to fructose compared to glucose. The fluorescence lifetime measurements further confirmed the compounds' capability to detect sugars. At elevated pH levels, the boronic acid groups exist predominantly in their anionic form [B(OH)3-], which induces a change in the boron atom's hybridization from sp2 to sp3, facilitating binding with sugar molecules. Among the three compounds, compound 1 exhibited the highest association constant with fructose, suggesting a stronger binding affinity is higher than compared to glucose. To further validate the sugar-sensing behavior, the quantum yields of the compounds were measured in pure water, glucose, and fructose solutions. When higher concentrations of the sensor were introduced into the sugar solution, the oxidation peaks current (Ipa) decreased while the reduction peak current (Ipc) increased. In contrast, Ipa increased in the sensor-only solutions. Based on these observations, a plausible sensing mechanism has been proposed.
| Published in | Science Journal of Analytical Chemistry (Volume 14, Issue 2) |
| DOI | 10.11648/j.sjac.20261402.11 |
| Page(s) | 18-27 |
| Creative Commons |
This is an Open Access article, distributed under the terms of the Creative Commons Attribution 4.0 International License (http://creativecommons.org/licenses/by/4.0/), which permits unrestricted use, distribution and reproduction in any medium or format, provided the original work is properly cited. |
| Copyright |
Copyright © The Author(s), 2026. Published by Science Publishing Group |
Saccharide Sensor, Boronic Acid, Fluorescence Sensor, Electrochemical Sensor, Glucose, Fructose
Concentration of sugars (M) | Compound 1 | Compound 2 | Compound 3 | |||||||||||||||
|---|---|---|---|---|---|---|---|---|---|---|---|---|---|---|---|---|---|---|
with glucose | with fructose | with glucose | with fructose | with glucose | with fructose | |||||||||||||
abs | log | flu | abs | log | flu | abs | log | flu | abs | log | flu | abs | log | flu | abs | log | flu | |
0 | 540 385 324 269 | 4.19 4.06 4.33 | 470 441 | 540 385 325 269 | 4.19 4.06 4.33 | 470 441 | 488 324 310 278 | 3.20 3.45 3.46 4.22 | 687 663 | 488 324 310 278 | 3.20 3.45 3.46 4.22 | 687 663 | 490 325 310 278 | 3.34 3.53 3.51 4.23 | 688 664 | 490 325 310 278 | 3.34 3.53 3.51 4.23 | 688 664 |
0.002 | 540 385 325 268 | 4.18 4.05 4.32 | 471 440 | 540 385 325 269 | 4.19 4.04 4.32 | 471 440 | 487 325 310 277 | 3.18 3.44 3.45 4.22 | 687 663 | 488 324 310 278 | 3.15 3.48 3.47 4.29 | 687 663 | 490 324 309 278 | 3.29 3.51 3.50 4.20 | 688 664 | 491 325 310 279 | 3.32 3.49 3.47 4.21 | 688 664 |
0.010 | 540 386 325 268 | 4.17 4.05 4.31 | 470 439 | 540 385 325 269 | 4.17 4.01 4.29 | 470 439 | 488 324 311 279 | 3.08 3.38 3.44 4.21 | 687 663 | 487 324 310 278 | 3.06 3.41 3.41 4.24 | 687 663 | 490 324 309 278 | 3.18 3.43 3.41 4.18 | 688 664 | 490 324 310 278 | 3.24 3.42 3.41 4.19 | 688 664 |
Exci (nm) | 380 | 380 | 480 | 480 | 480 | 480 | ||||||||||||
K (1: 1) M-1 | 176 | 313 | 167 | 688 | 286 | 647 | 168 | 2482 | 347 | 351 | 344 | 796 | ||||||
Sensor- sugar | Sensor conc’n x 10-3 | Epa | Ipa | Epc | Ipc | Epa-Epc/2 | Ipa/Ipc |
|---|---|---|---|---|---|---|---|
Glucose only | 2 x 10⁻⁶ | 373 | 0.224 | - | - | -287 | - |
C1only | 2 | 763 | 0.566 | - | - | 381 | - |
C1-Glucose | 3 | 776 | 0.672 | - | - | 388 | - |
5 | 785 | 0.637 | - | - | 392 | - | |
7 | 819 | 0.628 | - | - | 409 | - | |
10 | 844 | 0.591 | - | - | 422 | - | |
C2 only | 2 | 800 | 0.749 | - | - | 400 | - |
C2-Glucose | 3 | 893 | 0.556 | - | - | 446 | - |
5 | 1010 | 0.924 | - | - | 505 | - | |
7 | 1069 | 1.089 | - | - | 534 | - | |
10 | 1116 | 1.253 | - | - | 558 | - | |
C3 only | 2 x 10⁻⁶ | 851 | 0.613 | - | - | 678 | - |
C3-Glucose | 3 | 773 | 0.922 | - | - | 396 | - |
5 | 793 | 0.880 | - | - | 386 | - | |
7 | 826 | 0.852 | - | - | 413 | - | |
10 | 869 | 0.720 | - | - | 484 | - |
Sensor- sugar | Sensor conc’n x 10-3 | Epa | Ipa | Epc | Ipc | Epa-Epc/2 | Ipa/Ipc |
|---|---|---|---|---|---|---|---|
Fructose only | 380 | 0.225 | - | - | -290 | - | |
C1only | 2 | 765 | 0.563 | - | - | 378 | - |
C1- Fructose | 3 | 777 | 0.670 | - | - | 385 | - |
5 | 786 | 0.634 | - | - | 392 | - | |
7 | 817 | 0.624 | - | - | 407 | - | |
10 | 842 | 0.588 | - | - | 421 | - | |
C2 only | 2 | 798 | 0.746 | - | - | 402 | - |
C2- Fructose | 3 | 890 | 0.553 | - | - | 444 | - |
5 | 1008 | 0.921 | - | - | 501 | - | |
7 | 1066 | 1.086 | - | - | 533 | - | |
10 | 1113 | 1.250 | - | - | 555 | - | |
C3 only | 2 x 10⁻⁶ | 851 | 0.610 | - | - | 676 | - |
C3- Fructose | 3 | 771 | 0.919 | - | - | 394 | - |
5 | 790 | 0.877 | - | - | 384 | - | |
7 | 822 | 0.848 | - | - | 411 | - | |
10 | 866 | 0.722 | - | - | 482 | - |
Compound 1 | 4 (2-phenyl diazenyl phenyl boronicacid) |
Compound 2 | 2 (4-diazenyl phenyl boronyl benzoicacid) |
Compound 3 | 4 (1- diazenyl phenyl boronyl benzoic acid) |
CV | Cyclic Voltammetry |
A0 | Absorbance of the Solution in Water |
IF | Fluorescence Intensity of the Solution in the Sensor |
I0 | Fluorescence Intensity of the Solution in Water |
A | Absorbance of the Solution in the Sensor |
τ | Life Time of the Species in the Excited State |
ns | Nanosecond |
α | The Electron Transfer Coefficient |
ks | The Standard Rate Constant of the Surface Reaction |
υ | The Scan Rate |
E₀ | The Formal Potential |
n | The Number of Electrons Transferred |
Ep | Electrode Potential |
IPa | Oxidation Peak Current |
IPc | Reduction Peak Current |
Csugar, [sugar], and [sugar-sensor] | Refer to the Total, Free, and Bound Sugar Concentrations in the Solution, Respectively |
| [1] |
Davis, A. P.; Wareham, R. S. Carbohydrate recognition through noncovalent interactions: a challenge for biomimetic and supramolecular chemistry. Angew. Chem. Int. Ed. Engl. 1999, 38, 2978-2996.
https://doi.org/10.1002/(SICI)1521-3773(19991004)38:19<2978::AID-ANIE2978>3.0.CO;2-S |
| [2] | Yoon, J.; Czarnik, A. W. Fluorescent chemosensors of carbohydrates. A means of signal amplification. J. Am. Chem. Soc. 1992, 114, 5874-5875. |
| [3] | Nagai, Y.; Kobayashi, K.; Toi, H.; Aoyama, Y. Multivalent sugar recognition by cyclophane hosts. Bull. Chem. Soc. Jpn. 1993, 66, 2965-2971. |
| [4] | James, T. D.; Sandanayake, K. R. A. S.; Shinkai, S. Chiral discrimination of monosaccharides using a fluorescent molecular sensor. Angew. Chem. Int. Ed. Engl. 1996, 35, 1910-1922. |
| [5] | James, T. D.; Shinmori, H.; Shinkai, S. Saccharide sensing with bis-boronic acid appended fluorophores. Chem. Commun., 1997, 71-72. |
| [6] | Kijima, H.; Takeuchi, M.; Robertson, A.; Shinkai, S.; Cooper, C. R.; James, T. D. Selective saccharide recognition using bis-boronic acid based fluorescent sensors. Chem. Commun., 1999, 2011-2012. |
| [7] | DiCesare, N.; Lakowicz, J. R. Fluorescent chemosensors based on boronic acid derivatives and boronic acid-based polymers. Org. Lett. 2001, 3, 3891-3893. |
| [8] | DiCesare, N.; Lakowicz, J. R. Boronic acid-based fluorescent probes for saccharide detection. J. Photochem. Photobiol. A 2001, 143, 39-47. |
| [9] | Cao, H.; McGill, T.; Heagy, M. D. Highly fluorescent boronic acid substituted anthracenes: synthesis and saccharide sensing properties. J. Org. Chem. 2004, 69, 2959-2966. |
| [10] | Egawa, Y.; Seki, T.; Takahashi, S.; Anzai, J. Fluorescence properties of boronic acid-anthracene conjugates and their application to saccharide sensing. Mater. Sci. Eng. C 2011, 31, 1257-1264. |
| [11] | Yamamoto, M.; Takeuchi, M.; Shinkai, S. Boronic acid-based saccharide sensing with fluorescent probes. Tetrahedron 1998, 54, 3125-3140 . |
| [12] | Egawa, Y.; Gotoh, R.; Niina, S.; Anzai, J. Fluorescent saccharide sensors based on boronic acid compounds. Bioorg. Med. Chem. Lett. 2007, 17, 3789-3792. |
| [13] | Jude Jenita, M.; Venkatesh, G.; Subramanian, V. K.; Rajendiran, N. Twisted intramolecular charge transfer effects on fast violet B and fast blue RR: effect of HP-α-CD and HP-β-CDs. J. Mol. Liq. 2013, 178, 160-167. |
| [14] | Rajendiran, N.; Sankaranarayanan, R. K.; Saravanan, J. Nanochain and vesicles formed by inclusion complexation of 4, 4′-diamino benzanilide with cyclodextrins. J. Exp. Nanosci. 2015, 10, 880-899. |
| [15] | Venkatesh, G.; Thulasidhasan, J.; Rajendiran, N. A spectroscopic and molecular modeling studies of the inclusion complexes of orciprenaline and terbutaline drugs with native and modified cyclodextrins. J. Incl. Phenom. Macrocycl. Chem. 2014, 78, 225-237. |
| [16] | Rajendiran, N.; Venkatesh, G. Inclusion complexation of 4, 4′-dihydroxy benzophenone and 4-hydroxy benzophenone with α- and β-CD. Supramol. Chem. 2014, 26, 783-795. |
| [17] | Rajendiran, N.; Sankaranarayanan, R. K.; Saravanan, J. Nanostructures formed by cyclodextrin covered amino benzophenones through supramolecular self-assembly. Spectrochim. Acta A 2014, 127, 52-60. |
| [18] | Jude Jenita, M.; Mohandoss, T.; Rajendiran, N. Spectral and molecular modeling studies on hydroxy benzaldehydes with native and modified cyclodextrins. J. Fluoresc. 2014, 24, 695-707. |
| [19] | Jude Jenita, M.; Venkatesh, G.; Thulasidasan, J.; Rajendiran, N. Excimer formation in inclusion complexes of antihypertensive drugs with HP-α- and HP-β-CDs. Indian J. Chem. A 2013, 52, 207-216. |
| [20] | Rajendiran, N.; Sankaranarayanan, R. K. Nanorod formation of cyclodextrin covered sudan dyes through supramolecular self assembly. J. Exp. Nanosci. 2015, 10, 407-428. |
| [21] | DiCesare, N.; Lakowicz, J. R. New boronic acid-based fluorescent probes with high sensitivity to monosaccharides. Tetrahedron Lett. 2001, 42, 9105-9108. |
| [22] | DiCesare, N.; Lakowicz, J. R. Fluorescent probes based on boronic acids: modulation of fluorescence intensity with monosaccharides. J. Phys. Chem. A 2001, 105, 6834-6840. |
| [23] | Gao, X.; Zhang, Y.; Wang, B. Fluorescent sensors based on boronic acid. Org. Lett. 2003, 5, 4615-4618. |
| [24] | Gao, X.; Zhang, Y.; Wang, B. Molecular recognition of saccharides based on boronic acid sensors. Tetrahedron 2005, 61, 9111-9117. |
| [25] | Mader, H.; Wolfbeis, O. S. Boronic acid-based probes and sensors for sugar recognition. Microchim. Acta 2008, 162, 1-34. |
| [26] | Antony Muthu Prabu, A.; Venkatesh, G.; Rajendiran, N. Fluorescent sensing of carbohydrates using a boronic acid-pyrene derivative. J. Fluoresc. 2010, 20, 961-972. |
| [27] | Cao, Z.; Nandhikonda, P.; Heagy, M. D. Boronic acid fluorescent sensors for monosaccharides and their hydrolysis by glycosidases. J. Org. Chem. 2009, 74, 3544-3546. |
| [28] | Beaudoin, D. S.; Obare, S. O. Boronic acid-substituted anthracenes as chemosensors for saccharides. Tetrahedron Lett. 2008, 49, 6054-6057. |
| [29] | Zhao, J. Z.; Davidson, M. G.; Mahon, M. F.; Kociok-Kohn, G.; James, T. D. Selective saccharide binding by boronic acid-based sensors. J. Am. Chem. Soc. 2004, 126, 16179-16186. |
| [30] | Liang, X.; James, T. D.; Zhao, J. Design of fluorescent sensors for selective detection of saccharides. Tetrahedron 2008, 64, 1309-1315 . |
| [31] | Cao, H.; Diaz, D. I.; DiCesare, N.; Lakowicz, J. R.; Heagy, M. D. New boronic acid fluorophores for saccharide sensing. Org. Lett. 2002, 4, 1503-1505 . |
| [32] | Mizuno, T.; Fukumatsu, T.; Takeuchi, M.; Shinkai, S. Synthesis and saccharide sensing behavior of boronic acid-functionalized molecules. J. Chem. Soc. Perkin Trans. 2000, 1, 407-413. |
| [33] | Yan, J.; Fang, H.; Wang, B. Boronic acid-based chemical sensors for saccharide detection. Med. Res. Rev. 2005, 25, 490-520. |
| [34] | Tony D. James.; Philip A. Sandanayake.; Seiji Shinkai. A family of boronic acid-based sensors with high specificity for saccharides. J. Am. Chem. Soc. 2002, 124, 5000-5012. |
| [35] | Oehlke, A.; Hofmann, J.; Krause, T.; Würfel, W.; Reissig, H.-U.; Böhm, M.; Müller, T.; Schneider, S. Boronic acid-based saccharide sensors: synthesis, binding behavior and theoretical investigation. J. Org. Chem. 2007, 72, 4328-4339. |
| [36] | Ward, C. J.; Patel, P.; James, T. D. Fluorescent boronic acid-based sensors for saccharides. Org. Lett. 2002, 4, 477-479. |
| [37] | Ward, C. J.; Patel, P.; James, T. D. Colorimetric and fluorescent sensing of saccharides using boronic acids. J. Chem. Soc. Perkin Trans. 2002, 1, 462-470. |
| [38] | Wiskur, S. L.; Lavigne, J. J.; Ait-Haddou, H.; Lynch, V.; Chiu, Y.-H.; Canary, J. W.; Anslyn, E. V. Fluorescent sensors for saccharide recognition based on boronic acids. Org. Lett. 2001, 3, 1311-1314. |
| [39] | Ni, W.; Kaur, G.; Springsteen, G.; Wang, B. Carbohydrate recognition by boronic acid-dye systems in aqueous media. Bioorg. Chem. 2004, 32, 571-581. |
| [40] | Franzen, S.; Ni, W.; Wang, B. Saccharide recognition in aqueous solution using boronic acids. J. Phys. Chem. B 2003, 107, 12942-12948. |
| [41] | Zhu, L.; Zhong, Z.; Anslyn, E. V. Differentiation of saccharides by a fluorescent receptor array using boronic acids. J. Am. Chem. Soc. 2006, 128, 1222-1232. |
| [42] | Heli, H.; Majdi, S.; Sattarahmady, N.; Moosavi-Movahedi, A. A.; Yadegari, H.; Ghourchian, H. Electrochemical study of boronic acid-based saccharide sensors. J. Electroanal. Chem. 2007, 610, 67-74. |
| [43] | Carter, M. T.; Rodriguez, M.; Bard, A. J. Voltammetric studies of organic receptor-substrate interactions: electrochemical characterization of molecular recognition. J. Am. Chem. Soc. 1989, 111, 8901-8911. |
APA Style
Suresh, M., Rajendiran, N., Ramasamy, P., Senthilmurugan, S. (2026). Naphthalene Based Azo Dyes and Its Substituted Derivatives Containing Mono Boronic Acid - Saccharide Sensors. Science Journal of Analytical Chemistry, 14(2), 18-27. https://doi.org/10.11648/j.sjac.20261402.11
ACS Style
Suresh, M.; Rajendiran, N.; Ramasamy, P.; Senthilmurugan, S. Naphthalene Based Azo Dyes and Its Substituted Derivatives Containing Mono Boronic Acid - Saccharide Sensors. Sci. J. Anal. Chem. 2026, 14(2), 18-27. doi: 10.11648/j.sjac.20261402.11
@article{10.11648/j.sjac.20261402.11,
  author = {Murugesan Suresh and Narayanasamy Rajendiran and Palanichamy Ramasamy and Sengamalai Senthilmurugan},
  title = {Naphthalene Based Azo Dyes and Its Substituted Derivatives Containing Mono Boronic Acid - Saccharide Sensors},
  journal = {Science Journal of Analytical Chemistry},
  volume = {14},
  number = {2},
  pages = {18-27},
  doi = {10.11648/j.sjac.20261402.11},
  url = {https://doi.org/10.11648/j.sjac.20261402.11},
  eprint = {https://article.sciencepublishinggroup.com/pdf/10.11648.j.sjac.20261402.11},
  abstract = {Three novel naphthalene-based azo dyes incorporating boronic acid functional groups were synthesized. Their sugar-sensing behavior toward glucose and fructose was systematically investigated using UV-visible, fluorescence, time-resolved fluorescence, pH titration, and cyclic voltammetry techniques. Upon increasing the concentration of the sugars, both the absorbance and fluorescence intensities of the dyes decreased, indicating effective interaction. In the excited state, the dyes exhibited stronger sensing responses to fructose compared to glucose. The fluorescence lifetime measurements further confirmed the compounds' capability to detect sugars. At elevated pH levels, the boronic acid groups exist predominantly in their anionic form [B(OH)3-], which induces a change in the boron atom's hybridization from sp2 to sp3, facilitating binding with sugar molecules. Among the three compounds, compound 1 exhibited the highest association constant with fructose, suggesting a stronger binding affinity is higher than compared to glucose. To further validate the sugar-sensing behavior, the quantum yields of the compounds were measured in pure water, glucose, and fructose solutions. When higher concentrations of the sensor were introduced into the sugar solution, the oxidation peaks current (Ipa) decreased while the reduction peak current (Ipc) increased. In contrast, Ipa increased in the sensor-only solutions. Based on these observations, a plausible sensing mechanism has been proposed.},
 year = {2026}
}
TY  - JOUR
T1  - Naphthalene Based Azo Dyes and Its Substituted Derivatives Containing Mono Boronic Acid - Saccharide Sensors
AU  - Murugesan Suresh
AU  - Narayanasamy Rajendiran
AU  - Palanichamy Ramasamy
AU  - Sengamalai Senthilmurugan
Y1  - 2026/04/13
PY  - 2026
N1  - https://doi.org/10.11648/j.sjac.20261402.11
DO  - 10.11648/j.sjac.20261402.11
T2  - Science Journal of Analytical Chemistry
JF  - Science Journal of Analytical Chemistry
JO  - Science Journal of Analytical Chemistry
SP  - 18
EP  - 27
PB  - Science Publishing Group
SN  - 2376-8053
UR  - https://doi.org/10.11648/j.sjac.20261402.11
AB  - Three novel naphthalene-based azo dyes incorporating boronic acid functional groups were synthesized. Their sugar-sensing behavior toward glucose and fructose was systematically investigated using UV-visible, fluorescence, time-resolved fluorescence, pH titration, and cyclic voltammetry techniques. Upon increasing the concentration of the sugars, both the absorbance and fluorescence intensities of the dyes decreased, indicating effective interaction. In the excited state, the dyes exhibited stronger sensing responses to fructose compared to glucose. The fluorescence lifetime measurements further confirmed the compounds' capability to detect sugars. At elevated pH levels, the boronic acid groups exist predominantly in their anionic form [B(OH)3-], which induces a change in the boron atom's hybridization from sp2 to sp3, facilitating binding with sugar molecules. Among the three compounds, compound 1 exhibited the highest association constant with fructose, suggesting a stronger binding affinity is higher than compared to glucose. To further validate the sugar-sensing behavior, the quantum yields of the compounds were measured in pure water, glucose, and fructose solutions. When higher concentrations of the sensor were introduced into the sugar solution, the oxidation peaks current (Ipa) decreased while the reduction peak current (Ipc) increased. In contrast, Ipa increased in the sensor-only solutions. Based on these observations, a plausible sensing mechanism has been proposed.
VL  - 14
IS  - 2
ER  -
Department of Chemistry, MRG Arts College, Mannargudi, India
Department of Chemistry, Annamalai University, Annamalai Nagar, India
Molecular Biophysics Unit, Indian Institute of Science, Bangalore, India
Department of Zoology, Annamalai University, Annamalai Nagar, India
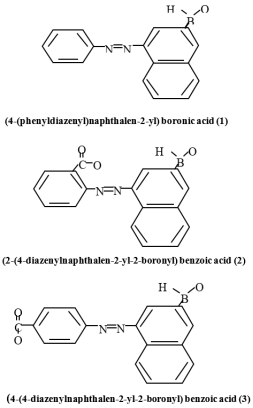
Figure 1. Structures of synthesised compounds 1, 2 and 3.
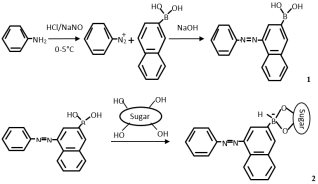
Figure 2. Diazotization (1) and coupling reaction (2) methods.
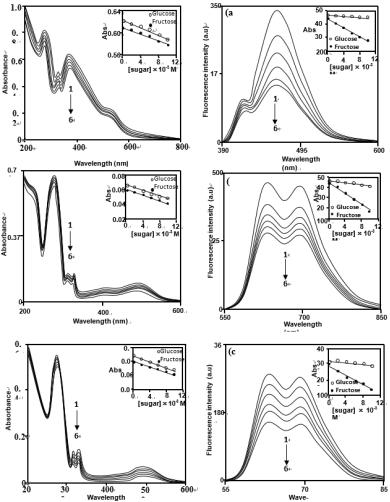
Figure 3. Absorption and fluorescence spectra of (a) compound 1 (b) compound 2 and (c) compound 3 (8 x 10⁻⁵ M) with increasing concentration of D-glucose and fructose: 1) 0, 2) 0.002, 3) 0.004, 4) 0.006, 5) 0.008, 6) 0.01 measured in phosphate buffer solution at pH ~ 7.0.
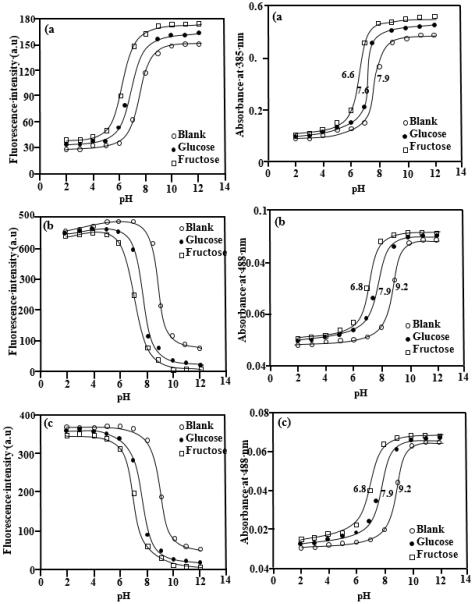
Figure 4. pH titration curves for sugar sensor vs glucose and fructose in the absorption and fluorescence spectra (0.01M); (a) compound 1, (b) compound 2, and (c) compound 3 (8 x 10⁻⁵ M) measured in buffer solutions at room temperature; pKa values are given in the figure. Sugar sensor vs glucose and fructose in the fluorescence intensity; (0.01M) for (a) compound 1 (<i></i>ex =380 nm, <i></i>em = 468 nm) (b) compound 2 (<i></i>ex =480 nm, <i></i>em = 684 nm) and (c) compound 3 (<i></i>ex = 480 nm, <i></i>em = 686 nm (8 x10⁻⁵ M) measured in buffer solutions.
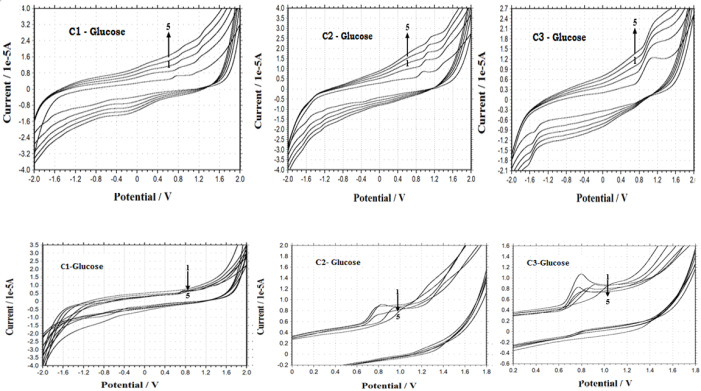
Figure 5. Cyclic voltammograms of glucose (in carbon electrode) with different concentrations of sensor (a) C1, (b) C2 and (c) C3 (x 10-4 M): 1) 0, 2), 3, 3) 7 and 4) 10.